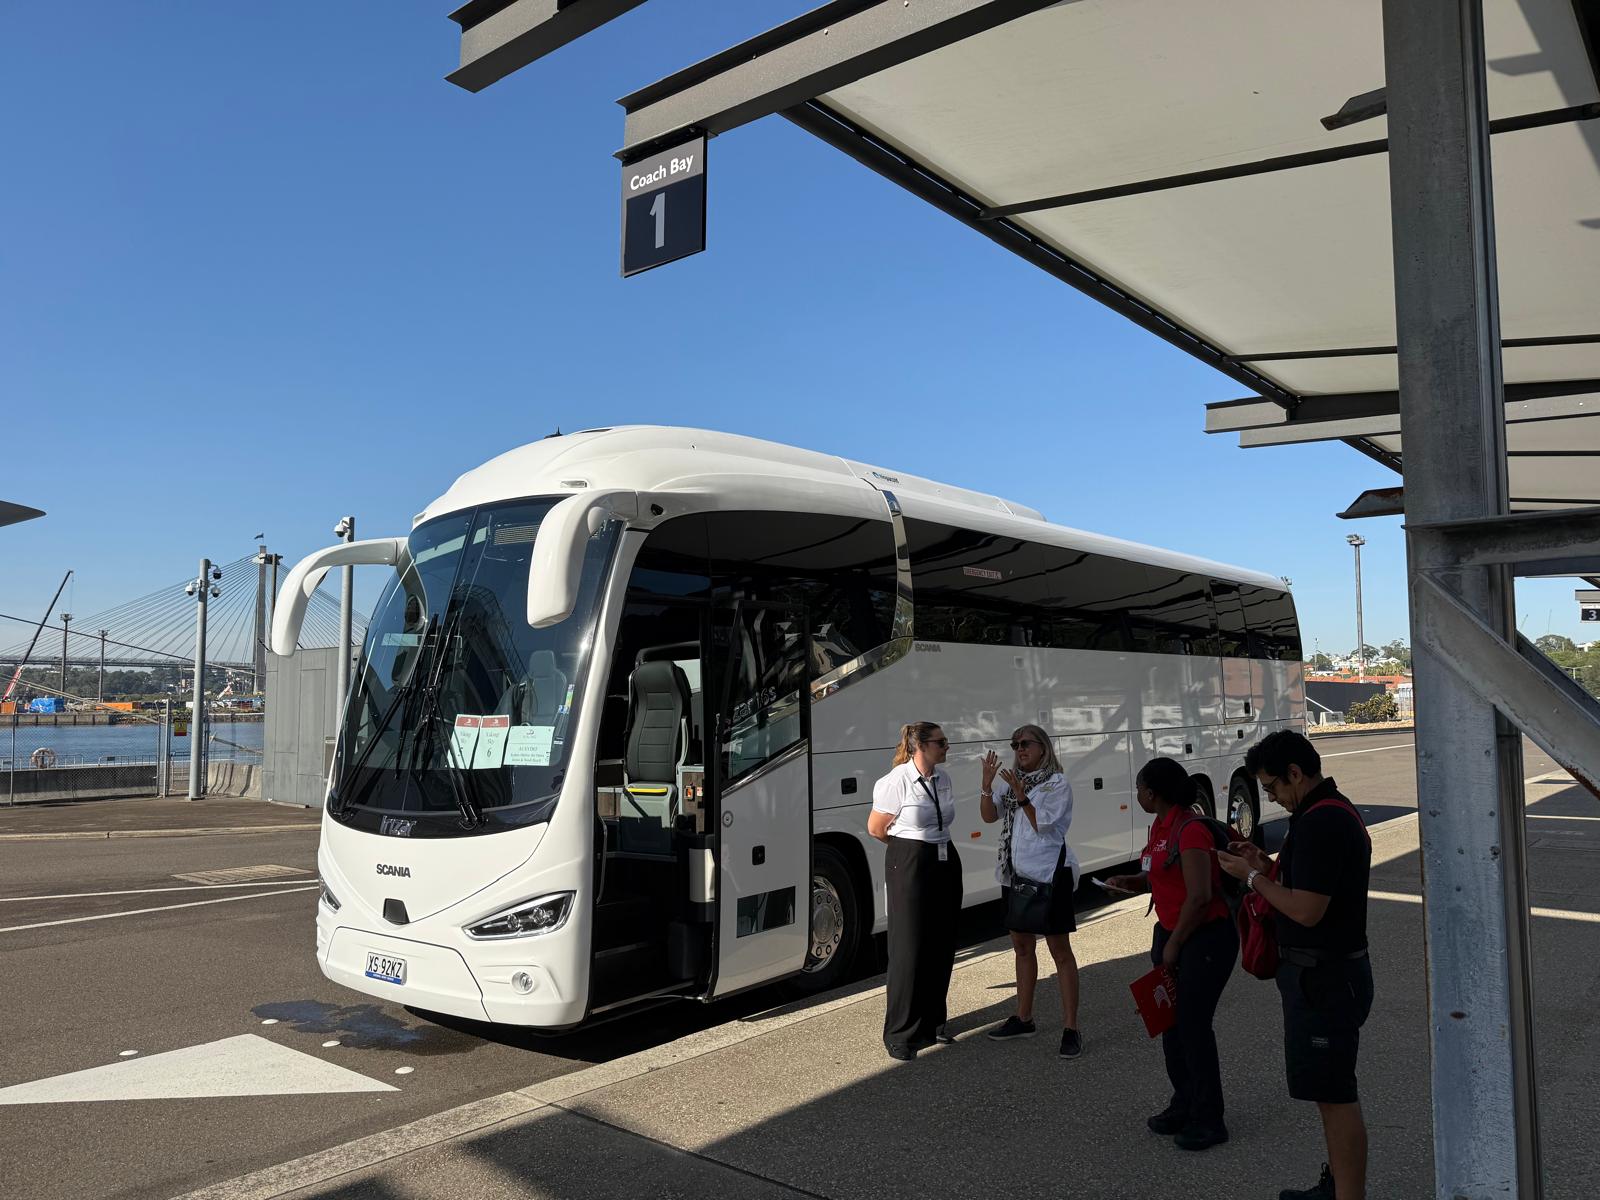
Measure a staff shuttle on seven things: boardings by departure, peak load factor, left-behind events, punctuality at the deadline end, cycle time drift, cost per boarding, and what the shuttle displaced. Collect all seven from week one, review them monthly and formally each quarter, and judge the service on its busiest and emptiest departures rather than on an average. That set is also, conveniently, the evidence a budget holder needs to keep funding it.
Start by writing down what the shuttle is for
Before choosing measures, write one sentence naming the problem the shuttle solves. It decides what good looks like.
A shuttle that exists to relieve pressure on a car park is judged on cars removed. A shuttle that exists because the last leg from public transport is unwalkable is judged on whether people can reliably get to work. A shuttle that exists to make a dispersed site liveable for shift workers is judged on coverage of the shift change. These are three different services and they can look identical on a timetable.
Sydney’s dispersed employment precincts usually produce the first two. In places like Macquarie Park and Norwest, the shuttle competes against staff driving and parking on site, not against a train. That makes the honest comparison a parking comparison, and only you have those numbers.
The seven measures
1. Boardings by departure
The base count, and the only one everything else is built from. Not boardings per day, and not boardings per week. Per departure.
An average hides both failure modes at once: the 8:15 run that turns people away and the 10:45 run carrying two people. A daily total of 90 could be six healthy runs or two overloaded ones and four empty ones, and the fix is completely different.
2. Peak load factor
The busiest single departure divided by the seats on the vehicle. This is the number that tells you whether the vehicle is the right size, and it is the one to watch weekly in the first month.
Approaching capacity on the busiest run is not a success signal. It is an early warning, because the next incremental rider is the one who gets left behind.
3. Left-behind events
Count every occasion a person presented at a stop and could not board. This is the single most damaging failure a shuttle has, and it is almost never recorded.
Two left-behind events will cost you a rider permanently. That rider goes back to driving, and they tell colleagues. Ridership decline usually starts here rather than with a gradual loss of interest, and by the time it shows in the boarding count the cause is months old.
4. Punctuality at the deadline end
Measure arrival against the time that matters, which is usually start of shift or start of session, not departure from the origin. A shuttle that leaves on time and arrives late has failed.
Record the actual arrival time, not “on time or not”. Distributions tell you whether you have a recovery time problem or a genuine congestion problem, and the remedies differ.
5. Cycle time drift
Compare the current round trip against the figure the route was designed on. Drift means the timetable is quietly becoming fiction.
In Sydney, one source of drift is entirely predictable. Most school zones operate at 40 km/h from 8:00 to 9:30am and 2:30 to 4:00pm on notified school days, and both windows sit on the shuttle peaks. A route crossing school zones runs measurably faster during NSW school holidays, so compare term-time data with term-time data. Splitting your log by term dates costs nothing and removes a recurring false signal.
6. Cost per boarding
Vehicle hours multiplied by the hourly rate, divided by boardings for the same period. Simple, and it is the number a finance business partner will ask for first.
The rate card behaviour matters here. Minimum hire is three hours for minibuses and people movers and four hours for midi-coaches and full-size coaches, so a large part of your cost is fixed to the block rather than to the number of runs inside it. Cost per boarding therefore falls steeply as ridership grows within a block you are already paying for, and jumps in a step when you add a vehicle. Two things follow: a lightly used shuttle is expensive per head for structural reasons rather than because anything is broken, and the cheapest available improvement is usually filling the block you already hold.
Tolls and parking sit outside the hourly rate and are confirmed in advance, so include them in the calculation rather than treating them as a separate line. On a shuttle they recur every single working day.
7. What the shuttle displaced
The measure that wins the budget argument, and the one most programmes never collect.
Depending on why the shuttle exists, that might be car park occupancy at the site, parking spend, taxi or rideshare reimbursements, or the share of a shift that reliably arrives on time. Take a baseline before the shuttle starts, because it is impossible to reconstruct afterwards.
What counts as healthy utilisation
There is no credible published benchmark for staff shuttle utilisation that would apply to your route, and any number quoted as an industry standard should be treated with suspicion. Load factor depends on the route, the frequency, the alternative available to staff and the reason the service exists.
Build your own baseline instead. Run the service for a full quarter, record boardings by departure, and take that quarter as the reference point. From then on the useful question is not “is 62 per cent good” but “is this departure moving up or down against its own history, and why”.
Two working rules do hold generally. A peak run consistently close to capacity means the vehicle is too small for that departure, whatever the daily average says. And a run that stays near empty for a full quarter is a candidate for removal or retiming, unless it serves a shift that only exists part of the year.
A monthly scorecard you can lift into a budget paper
Keep it to one page. The discipline is the point.
| Measure | This month | Last month | Baseline quarter | Action |
|---|---|---|---|---|
| Total boardings | ||||
| Busiest departure and its load factor | ||||
| Emptiest departure and its load factor | ||||
| Left-behind events | ||||
| Arrivals after the deadline time | ||||
| Average cycle time, term time only | ||||
| Cost per boarding, including tolls and parking | ||||
| Displacement measure (car park, parking spend, other) |
Then read it with this table, which turns each signal into a decision.
| What the data shows | What it usually means | What to change |
|---|---|---|
| Peak run near capacity, others light | Vehicle sized to the average, not the peak | Larger vehicle on the peak run, or split it into two departures |
| Left-behind events above zero | Capacity failure, and riders are already leaving | Fix immediately. This outranks cost per boarding |
| Late arrivals clustered on one leg | Insufficient recovery time or a congestion point | Add recovery time before adding vehicles |
| Cycle time drifting upward, term time | Route conditions have genuinely changed | Re-measure the route at the operating hour, then retime |
| One departure empty for a quarter | Wrong time, or serving a pattern that ended | Retime before cutting. Cutting is hard to reverse |
| Cost per boarding rising, boardings flat | Cost added without demand | Check whether an added vehicle is still needed |
| Cost per boarding high but stable, boardings growing | Structural, because minimum hire is fixed to the block | Grow ridership into the block before buying more hours |
The quarterly review with the operator
Monthly review is yours. Quarterly review should be joint, because half the useful information sits with the driver.
Bring boardings by departure, punctuality and any left-behind events. Ask the operator for what you cannot see: which leg is consistently the worst, where boarding is slow and why, whether a stop is unsafe or awkward for a vehicle of that size, and whether the timetable is achievable in current conditions or being held together by the driver.
Ask one further question, because it constrains what you can change. Any extension of the operating span runs into driver work and rest limits under the Heavy Vehicle National Law, which apply to charter operations. Adding an hour to each end of the day is often a second driver rather than a longer shift, and knowing that before you propose it saves a round trip through your own approvals.
Corporate bus hire in Sydney sets out the service, published hourly rates and minimum hire give the cost basis for the calculation, and the Greater Sydney regions we cover matter if the review points toward extending the route.
Turning the scorecard into a budget paper
When the shuttle comes up for renewal, the paper writes itself from the scorecard if you have kept it. Lead with the displacement measure, because that is the number in the reviewer’s own language. Follow with cost per boarding and its trend. Use left-behind events and punctuality to show the service is managed rather than simply running.
Attach the quarterly trend rather than a single month. A single month invites a debate about that month.
Frequently asked questions
What should we measure first?
Boardings by departure and left-behind events. Those two answer the only questions that matter early: is anyone using it, and is anyone being turned away. Everything else can be added in month two.
What utilisation is healthy for a staff shuttle?
There is no defensible universal figure. Set your own baseline over a full quarter and measure movement against it. A peak departure consistently at capacity means the vehicle is too small regardless of the daily average.
When should the route change?
When cycle time has drifted against the design figure in term-time data, when one departure has been near empty for a full quarter, or when left-behind events appear on the busiest run. Retime before you cut a stop, because cutting is much harder to reverse than moving.
How do we justify the cost internally?
With the displacement measure you baselined before launch, plus cost per boarding shown as a trend rather than a snapshot. Cost per boarding falls as ridership grows inside a minimum hire block you are already paying for, and that trend line is usually the most persuasive thing in the paper.
Should we count no-shows?
Count left-behind events, which are people the service failed. No-shows on a turn-up-and-go loop are not a meaningful number. On a booked shuttle they are worth watching, because persistent no-shows usually mean the departure time is wrong rather than that people are unreliable.
Next step
If your shuttle has been running long enough to have data, send us the boarding counts by departure and the current timetable, and we will review the route against them: cycle time re-measured at the actual operating hour, vehicle sizing against the peak departure, and where the frequency is being wasted.
To book a shuttle plan review with our operations team, call 02 9469 6600 or send the route and we will come back with a written response, usually within two business hours.
Sources
- Transport for NSW, “School zones”, https://www.transport.nsw.gov.au/roadsafety/community/schools/school-zones. Accessed 7 September 2026.
- NSW Department of Education, “School calendar 2026”, https://education.nsw.gov.au/schooling/calendars/2026. Accessed 7 September 2026.
- National Heavy Vehicle Regulator, “Heavy vehicle fatigue management, bus industry”, https://www.nhvr.gov.au/safety-accreditation-compliance/fatigue-management/heavy-vehicle-fatigue-management-bus-industry. Accessed 7 September 2026.